What is resampling, and why does a vegetation index map need it for small fields?
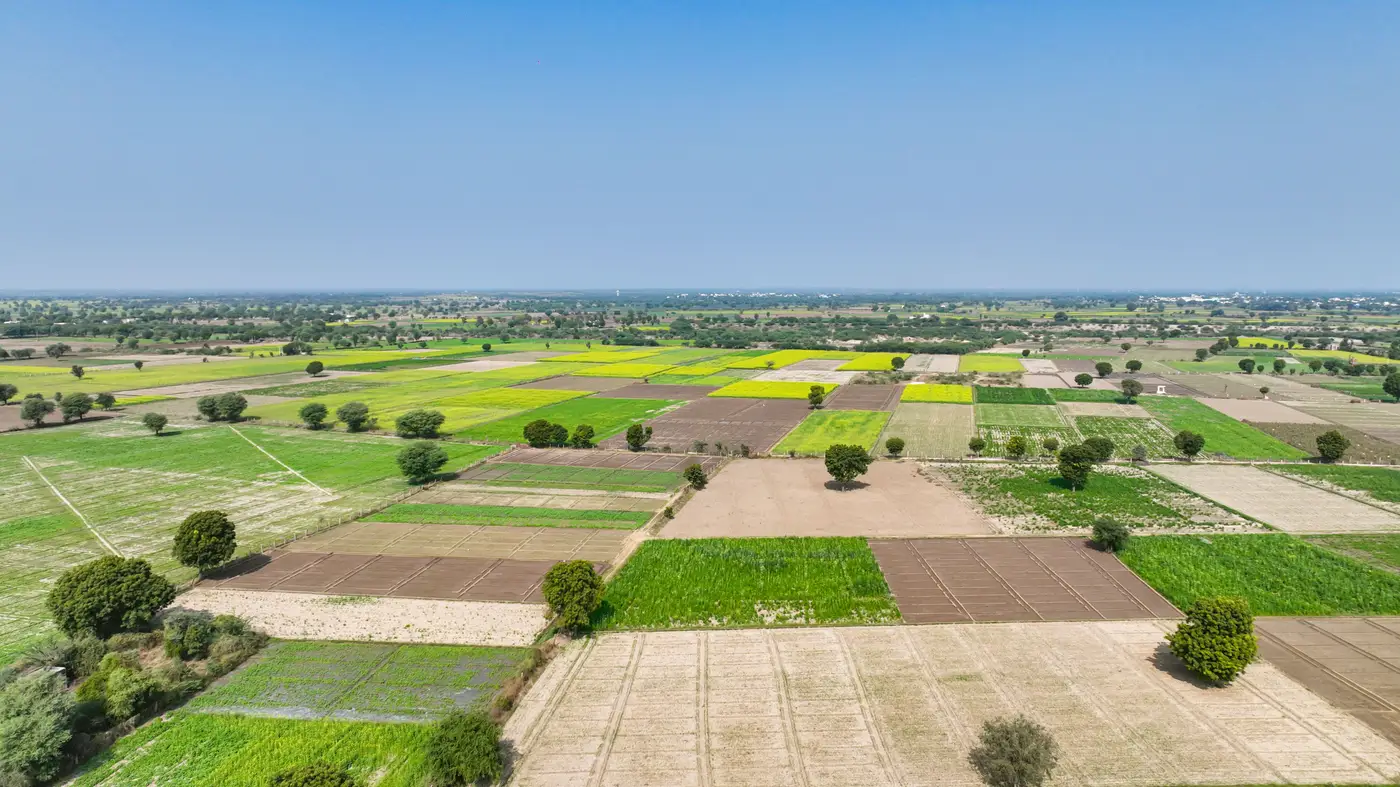
If you've pulled an NDVI tile over a half-hectare plot and watched the whole field collapse into one or two pixels, you've already run into the problem this post is about. The fix isn't always what the word "resampling" implies.
GSD versus field size, the actual math
Ground sample distance, GSD, is the real-world patch of land one pixel represents. Most wide-swath multispectral satellites that fly often enough to be useful for crop monitoring sit somewhere between 10 and 30 meters GSD. A 10m pixel covers 100 square meters. A 30m pixel covers 900.
Now put that next to the field. A smallholder plot of 0.3 to 0.5 hectares, which is common across a lot of advisory territory, might measure 30m by 100m, or be an irregular wedge following a drainage line. At 10m GSD, that field is maybe 30 to 50 pixels across its long edge but often only 3 to 4 pixels across its short edge, and the pixels along every border are mixed with the neighbor's crop, the bund, or bare track. At 30m GSD the whole field can be one pixel, sometimes shared with three other farmers' plots.
That's the core issue: the sensor is built for a different field size than the one an agronomist is trying to read. A wide-swath pass is designed to cover a lot of ground on a short revisit, and the tradeoff for that speed is a coarse grid. Nothing about the imagery itself tells you where your field's signal ends and the neighbor's begins.
What resampling does, and what it doesn't
Here's where people get tripped up, because "resampling" gets used two different ways.
The narrow, software sense is interpolation: taking a 10m grid and resizing it to, say, a 3m grid using bilinear or cubic methods. This makes the map look smoother and the field boundary looks cleaner on screen. It does not add any information the sensor didn't capture. The underlying mixed-pixel value, the one blending your crop with the access road, is still in there. You've just spread that same blurry number across more cells. An agronomist who zooms in on a resampled tile and reads it as higher resolution is reading noise as signal.
The sense that solves the smallholder problem is fusion: combining the wide-swath multispectral pass, which has the right spectral bands for vegetation index but the wrong pixel size, with a sharper-resolution look of the same ground at a nearby date. The fusion step uses the finer imagery to work out where the field edges and internal boundaries actually sit, then assigns the multispectral signal to the right side of that line instead of smearing it across a square that doesn't respect the field at all. That's a genuinely different operation from stretching a pixel grid in an image viewer, and it's the one that gets a per-field reading instead of a coarse regional average.
Why this matters for advisory work specifically
An advisory service covering a few hundred smallholder plots isn't trying to characterize a region, it's trying to tell farmer A's field from farmer B's field next door, and flag which specific plots are stressed this week. A coarse pixel that blends four fields into one average NDVI value can't do that. It'll show "moderate stress" for a block where one farmer is doing fine and three are losing the crop to waterlogging, and there's no way to tell which from the number alone.
This is the gap Field Scale Index was built to close: a weekly vegetation index fused from wide-swath multispectral passes and sharper looks, resampled down to the scale of the actual field boundary instead of a shared regional square. It's early access, built out field type by field type rather than as a finished national layer, so coverage depends on what's been fused for your area so far.
If you're tired of reading one pixel as four farmers' worth of crop condition, it's worth getting on the waitlist and seeing which field types are covered near you.