The map says the valley is green. Your plot may not be.
A weekly vegetation index taken inside each of your field boundaries, built by fusing wide-swath passes with sharper looks. Early access for advisory services working plots that are smaller than one source pixel.
- GSD
- Wide / 10–30 m source, resampled to field scale
- Cadence
- Weekly
- Platform
- Wide-swath satellite
- Spectral
- Multispectral
Planning the round from a map that averages your neighbours
You advise a lot of farmers, and most of their plots are small. The regional vegetation map arrives every week and you use it to decide who to visit. It works well enough on a large block. Over a valley of small holdings, though, one pixel covers pieces of several farms: a maize plot that was sown late, a bean plot at full canopy, a fallow strip, a track. The value on the map belongs to none of them.
So the round gets planned another way. You go where the road is good, where the cooperative has a meeting, where a farmer has already phoned. The plot that is slowly falling behind does not phone. It shows up on the visit, sometimes after the window to do anything about it has closed. Then a farmer asks why the map looked fine over a plot that plainly is not, and you have no reading of that plot to point to, only an average that includes its neighbours.
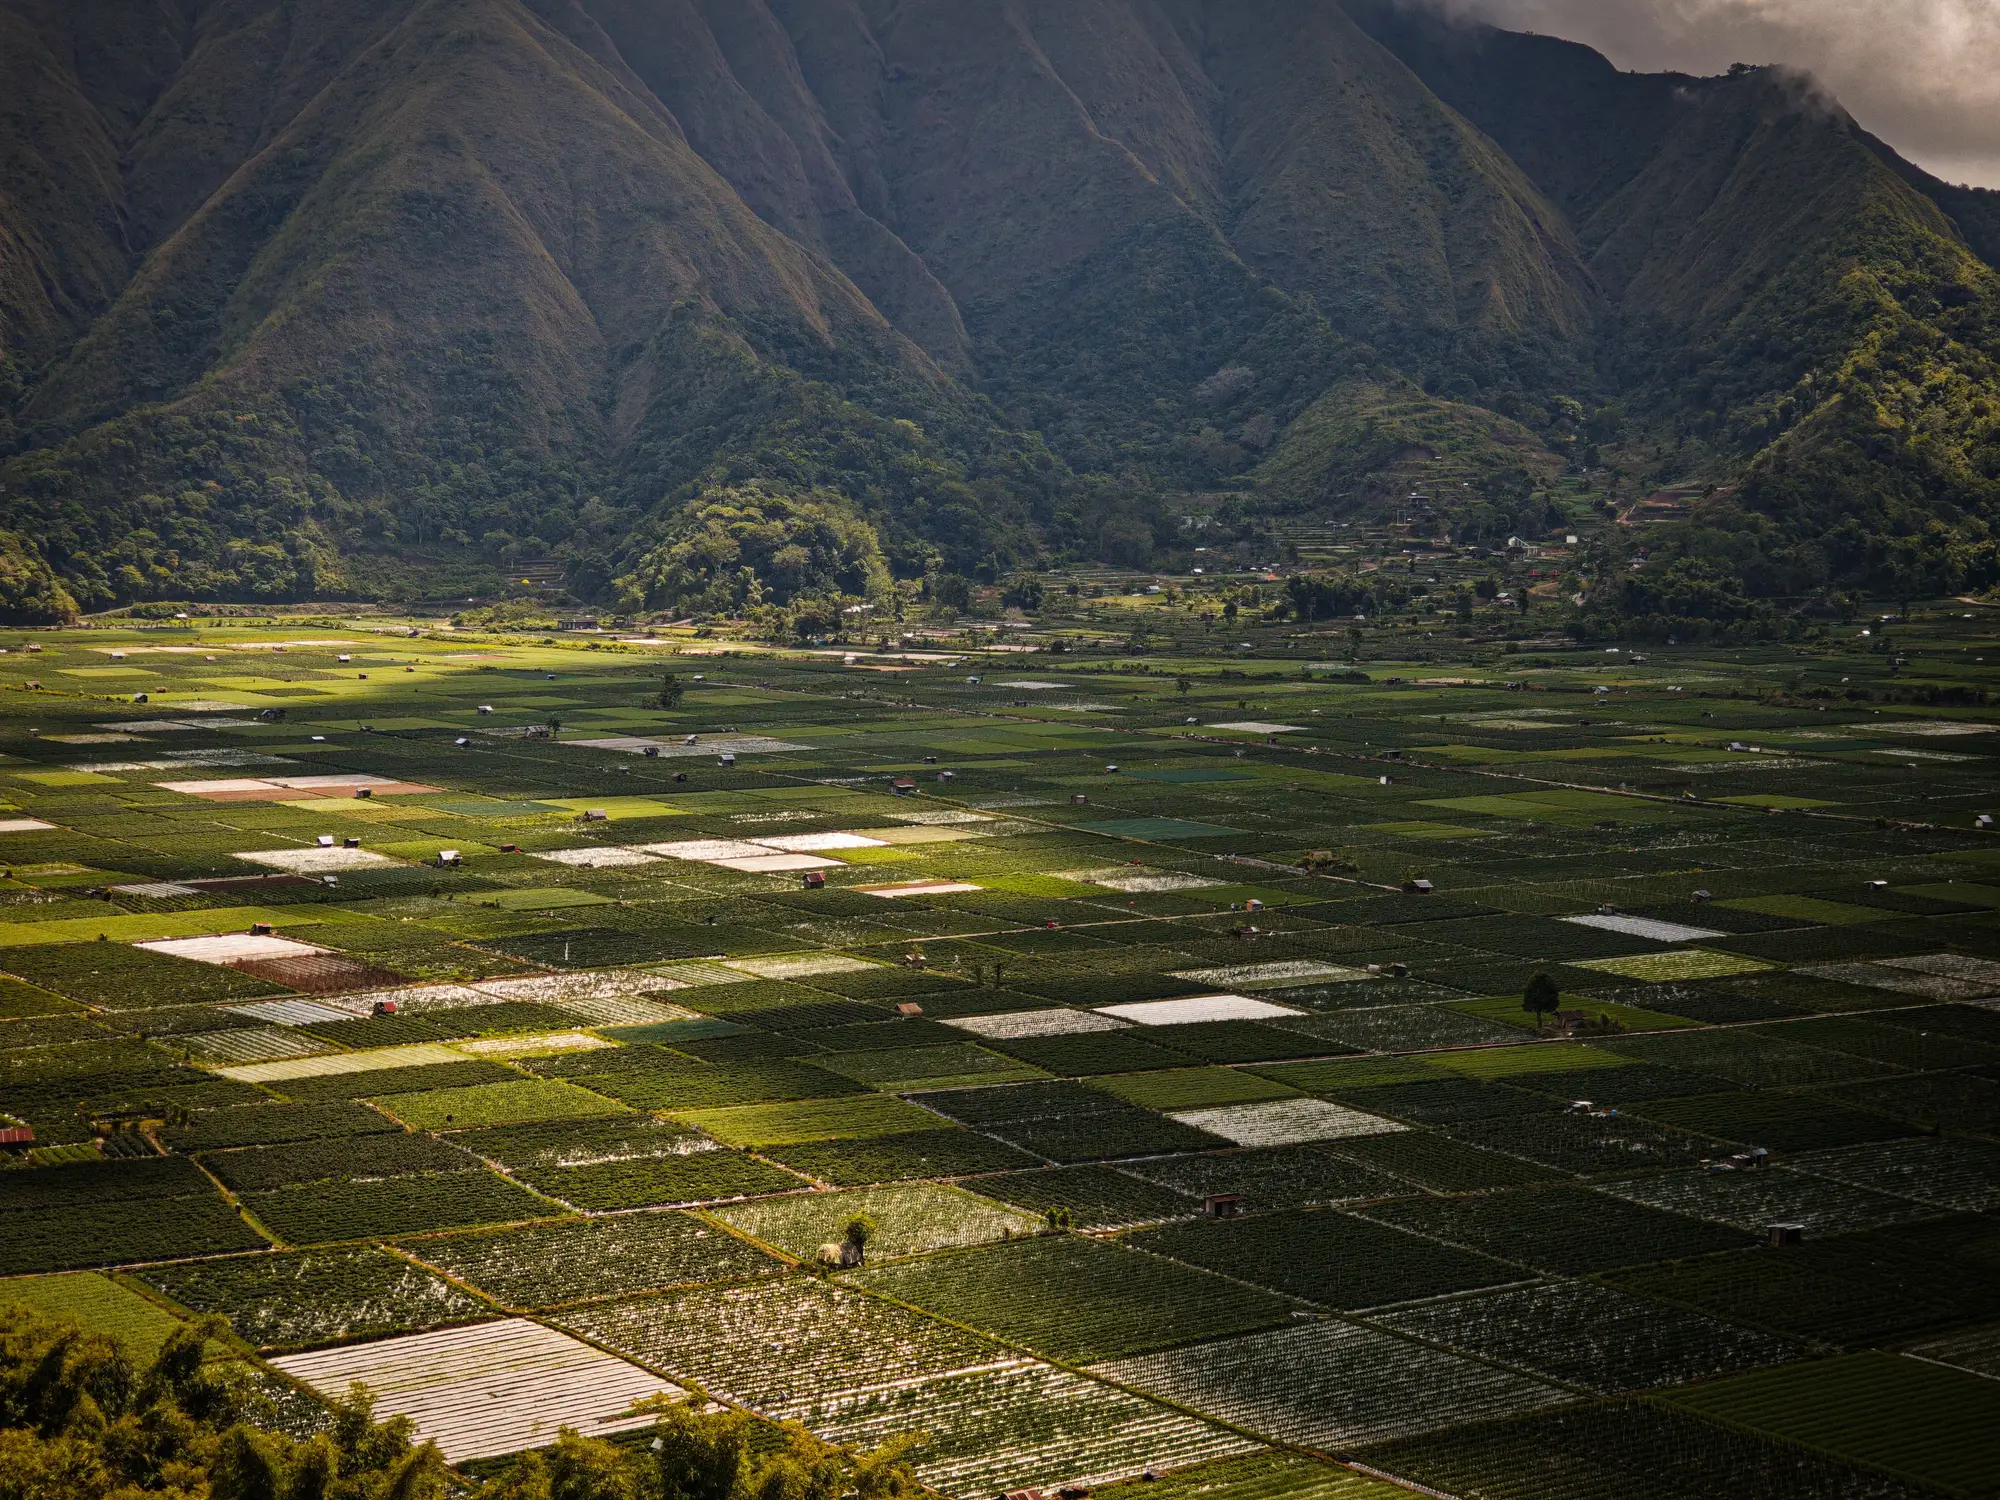
Field Scale Index is an early attempt at the missing piece: a reading for each of your own plots, each week, so the visit list starts from the plots and not from the road. It is not finished, and this page says where it stops.
What early access covers
Early access means we set it up for a small number of services, field type by field type, and you help decide what it should report. What follows is what we are building towards.
- 2.1
Per-field index value Weekly
One vegetation index value for each field polygon you send, each week a usable pass exists. It sits with the field ID so it joins to your register.
- 2.2
Season trend Per field
The weekly readings for a plot lined up across the season, so a plot that is drifting below its neighbours shows as a line and not a hunch.
- 2.3
Boundary overlay Vector layer
Your field polygons drawn over the index layer, to open in the GIS you already use and check against what you know of the plot.
- 2.4
CSV by field ID CSV
One row per field and week, keyed to your field IDs, so it drops into the spreadsheet you plan visits from.
How it works
- 3.1
Send your field boundaries
Upload polygons from your register or draw them for the plots you advise on. Tell us the crops and rough sowing window if you have them.
- 3.2
We check what is feasible
Before anything is promised, we look at your plot sizes and region and tell you whether a field-scale reading is realistic for them today.
- 3.3
Weekly pass and fusion
Each week the wide-swath multispectral pass is taken and combined with sharper looks to pull detail inside the pixel. Readings are resampled to your field boundaries.
- 3.4
Delivery
The index value, the trend and the overlay for your fields, in files you can open next to your register.
Where it fits in your workflow
Before your next advisory visit
It slots between the weekly wide-area composite you already get and the visit itself. You open the CSV, compare each plot with the others, and go to the ones that look off first. The visit is still where you find out why.
Limits
These are the places the reading can mislead you. Each is stated up front on purpose.
- L1
Source pixels are 10–30 m
The wide-swath passes are 10–30 m on the ground. Fusion adds detail inside the pixel, but it does not turn a wide sensor into a high-resolution one. Read "field scale" as a resampled product, and check the facts line for the source resolution.
- L2
Small plots have a floor
A plot has to cover several source pixels before it has an interior worth reading. Very small plots, narrow strips and plots ringed by trees or other crops are mostly edge, and a reading there is a weaker signal. We tell you which of your plots fall in that group.
- L3
Cloud skips a week
Optical sensing does not see through cloud. A cloudy week is left empty for that plot. We do not interpolate a value we did not observe, and there is no night-time reading.
- L4
An index, not a forecast
You get a vegetation index value and its trend. It is not a yield estimate and not a diagnosis. Whether a low reading is drought, pests, late sowing or a different crop is settled on the ground.
- L5
Weekly at best
The target is a reading each week. There is no daily or live feed.
- L6
Early access
The fusion pipeline is being built out field type by field type. Some regions and crop types will not be ready, and we say so before you commit.
Who it's for
For
- Agronomists and extension officers at advisory services whose farmers work small plots.
- Programme managers who want a weekly reading per plot to help decide where visits go.
- Services that already hold field boundaries, or can draw them, and want a reading inside them.
Not for
- Large-block arable farms, where the standard wide-swath composite already resolves the field.
- Anyone wanting a yield forecast or a per-plant diagnosis.
- Teams that need a daily or real-time feed.
- Buyers who want a finished national layer to switch on today.
Questions before you ask for access
Is this a finished product?
No. It is early access. We are building the fusion pipeline field type by field type and working with a small group first.
What does field scale mean here, exactly?
The source imagery is 10–30 m wide-swath. Field scale means the reading is resampled and fused to sit inside your field boundary. It is not a native high-resolution sensor.
What happens in a cloudy week?
That week is skipped for the plots under cloud. It stays empty in the trend and is never filled with an estimate.
Can it predict yield?
No. The deliverable is an index value and its trend across the season.
How do we check it against our own plots?
Compare the readings with what you see on the visit: crop stage, canopy, gaps. Tell us which plots you know well and we can look at those first.
Will it work on our plots?
It depends on their size and shape and on the crop. Send us the region and the polygons and we will say what is feasible today, including which plots are too small.
How does it connect to our register and GIS?
Everything is keyed to your field IDs, so it joins to your register and opens in a desktop GIS. Tell us what you run and we will say what is possible.
Who owns the outputs, and what about the imagery?
Terms for the delivered readings are written into the agreement before work starts. The public satellite archives the passes come from keep their own licences.
How is it priced?
Early access terms are agreed per service and written down before work starts, so you have something to take through your own approval.