Is that NDVI reading your field, or the field next door?
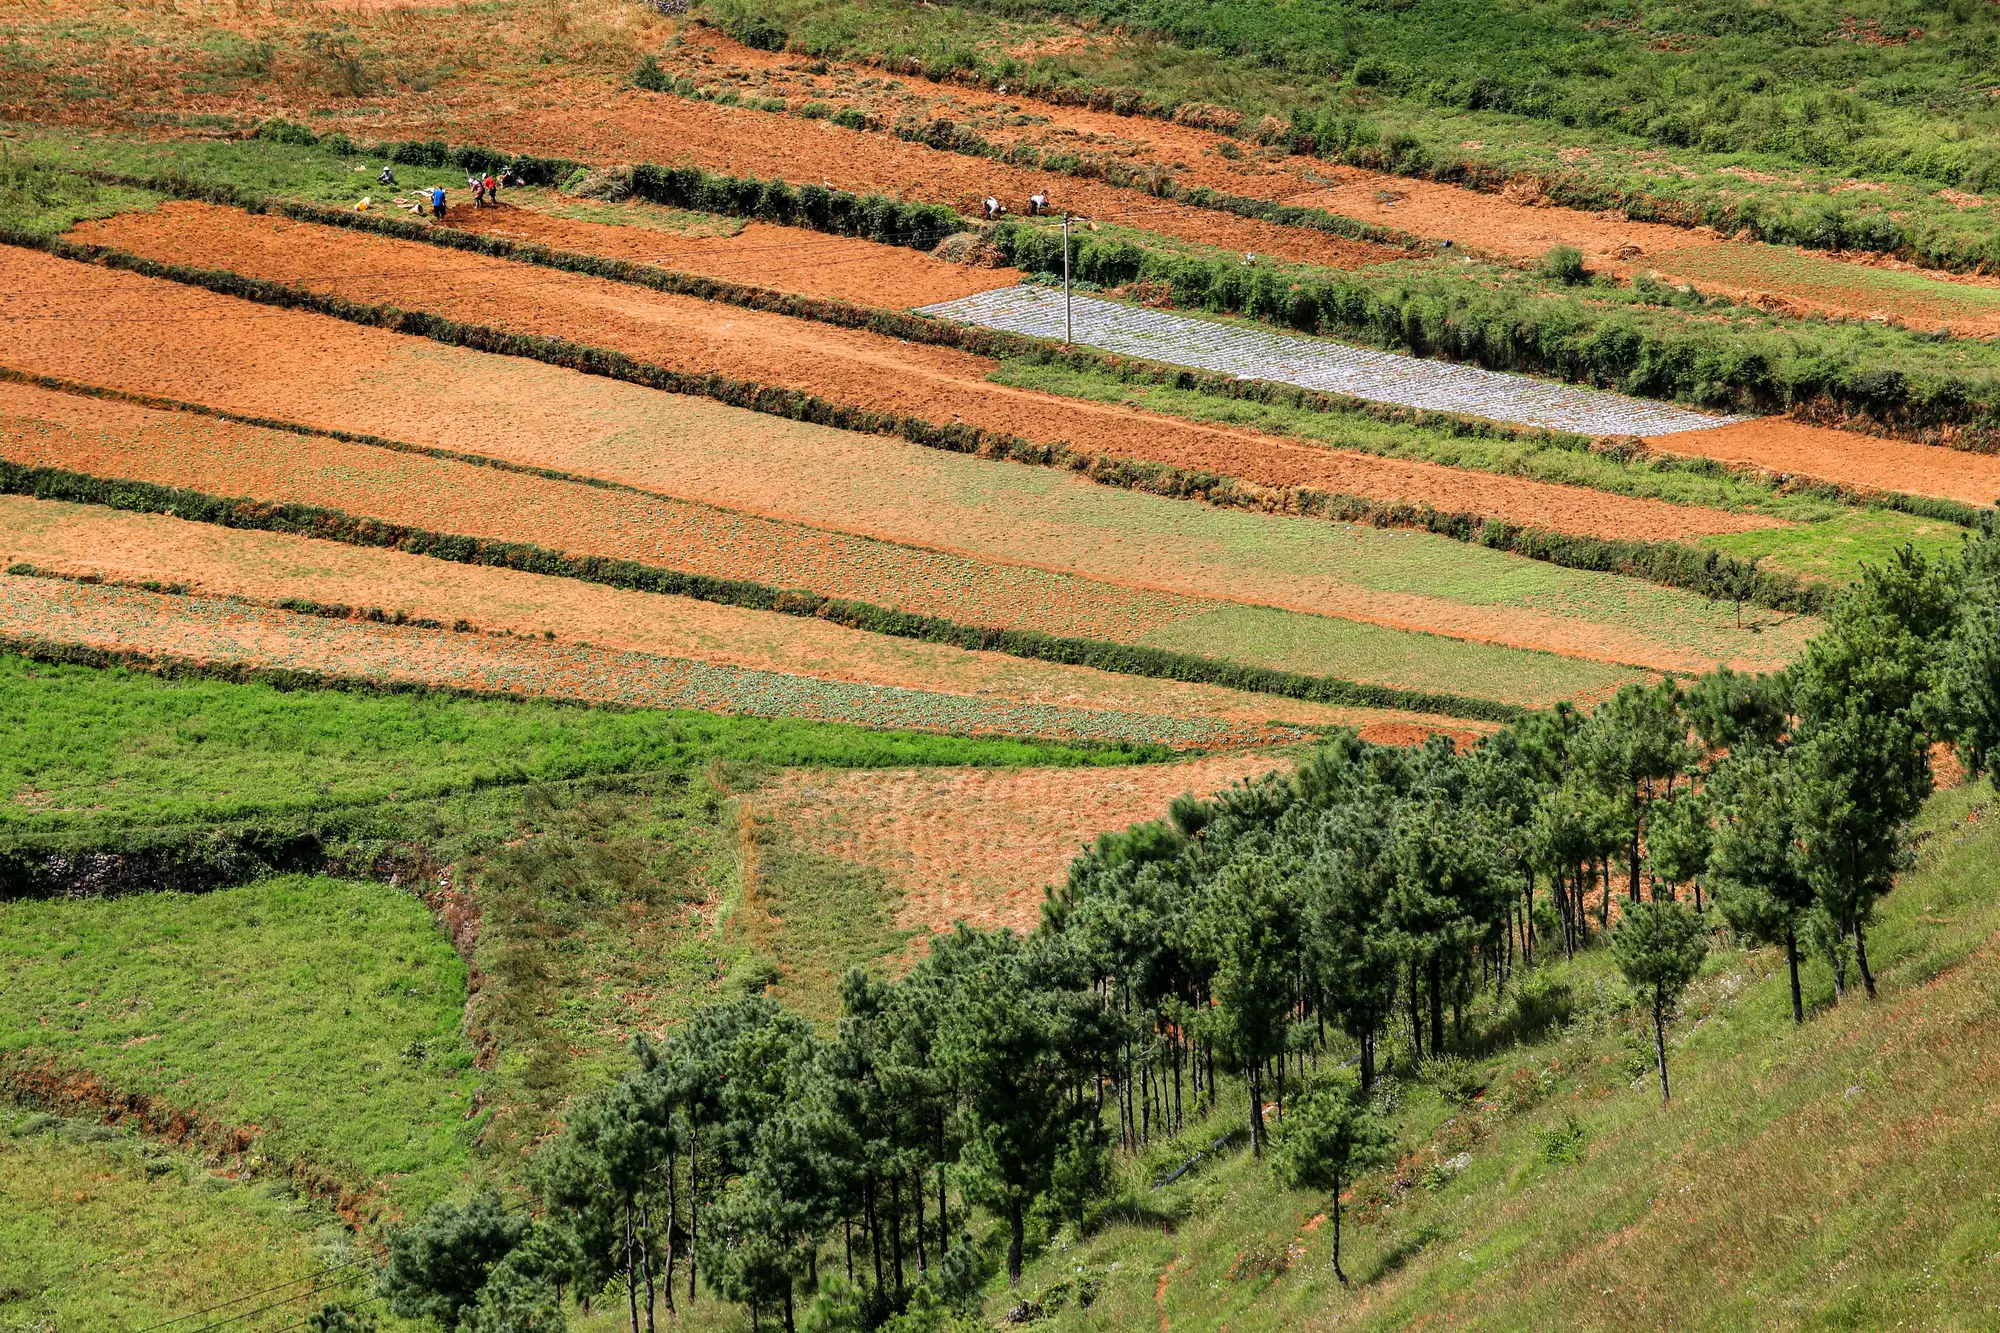
A farmer calls you confused. The index value you sent him shows his maize stressed, but he walked the field that morning and it looked fine. Most of the time, the pixel is reading mixed ground, and the crop is fine.
On a wide-swath multispectral pass, a single pixel can cover 10 to 30 meters on a side. On a smallholder plot, that's not a sliver of the field, it's a meaningful chunk of it, and sometimes it's bigger than the field itself. When a plot sits next to a neighbor growing something different, fallow ground, or a different planting date, the sensor doesn't know where one parcel ends and the next begins. It averages whatever land falls inside that square and hands you one number for the whole mix.
How a neighboring field ends up in your reading
Think of the pixel grid as a sheet laid over the landscape without regard for fence lines, ridges, or who planted what. If a farmer's half-hectare bean plot borders a two-hectare sorghum field that's further along in its growth cycle, any pixel straddling that border is going to carry sorghum reflectance into your bean reading. The smaller the plot relative to the pixel, the more of the reading comes from somewhere else entirely.
This shows up most on long, narrow plots, which is most smallholder land. A field that's 20 meters wide and 150 meters long might only contain one or two pixels that are mostly inside its own boundary. Everything else along the edges is shared with whatever's next door.
Signs the reading is blended, not real
A few patterns are worth checking before you act on a flag:
- The value doesn't move with the crop stage you know is on the ground. If the farmer reports vegetative growth but the index reads like bare soil or senescence, check what's planted immediately adjacent.
- The reading changes sharply at one edge of the plot and not the others. A clean gradient across the whole field usually means real variation in the crop. A hard step right at a boundary line usually means the pixel grid crossed a property line.
- Two neighboring plots report suspiciously similar numbers even when the farmers describe different planting dates or crops. That's often one blended value getting reported twice.
- The field is smaller, in at least one dimension, than the stated ground sample distance of the source imagery. If your plot is 15 meters wide and the source pixel is 20 or 30 meters, treat every value from that plot as a mix until proven otherwise.
None of these confirm contamination on their own, but two or three together are a strong signal to go look at the raw imagery, not just the index number.
Drawing a tighter boundary doesn't solve it by itself
A lot of advisory teams respond to this by refining the polygon they draw around the field, pulling it in tighter so it hugs the real boundary. That's good practice and worth doing, but it doesn't change what the underlying pixel measured. A precise boundary polygon tells the system where you want the answer to come from. It doesn't make the sensor's native resolution any finer. If the source pixel is 20 meters and your field is 12 meters wide, no amount of careful drawing recovers detail that was never captured at that scale. The polygon only helps once the index itself has been built at something closer to field scale, which means combining that wide-swath pass with a sharper look rather than relying on the coarse pass alone.
What to check before you trust a flag
Before passing a reading on to a farmer as a stress call, pull up the true-color image for the same date if you can get it, and look at what's actually sitting inside and around the plot boundary. Compare the field's dimensions to the stated resolution of your source imagery. And if a value doesn't match what a field visit or the farmer's own report tells you, assume edge contamination before you assume the crop is the problem.
If you're tired of second-guessing whether a reading belongs to the field you're advising or the one next to it, Field Scale Index is building weekly per-field readings specifically for plots this size, fusing the wide-swath pass with a sharper look instead of handing you one averaged number for a patch of mixed fields. Join the early access list to see it on your own advisory area.