Reading a vegetation index map on an intercropped smallholder plot
What's inside that pixel
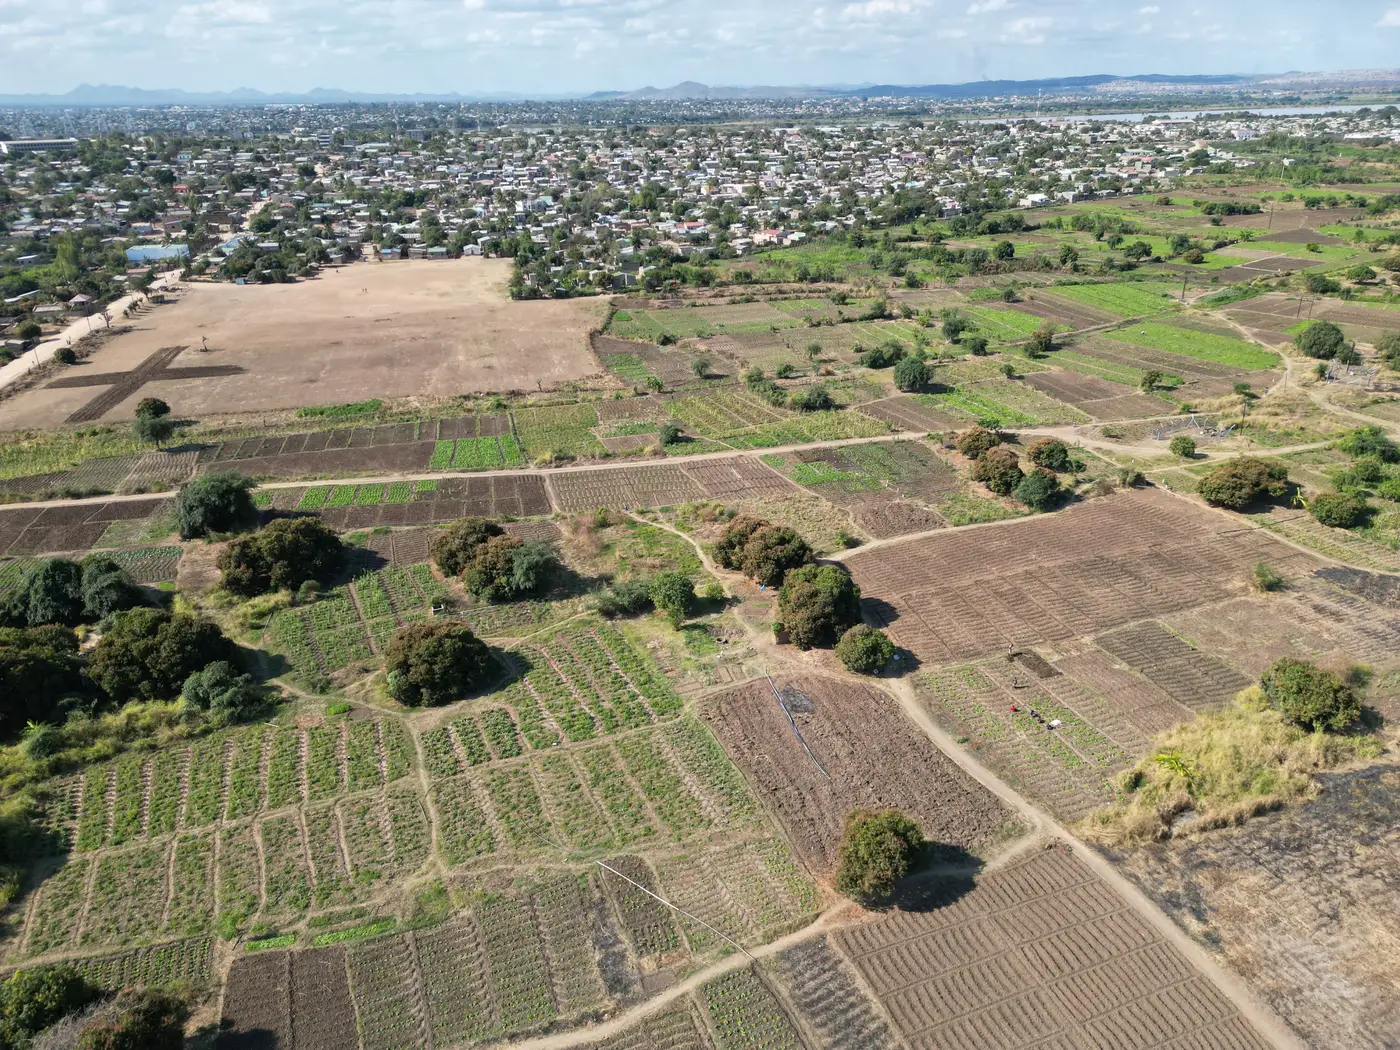
On a single large commercial field, a 10-30 m pixel from a wide-swath satellite covers one crop at one growth stage, so the index value is a reasonable stand-in for the vigor of the field. On a smallholder plot where maize is interplanted with beans or cassava in alternating rows, that same pixel might cover three crops, two soil breaks, and a footpath. The NDVI or EVI value you see is an average of all of it. A plot that reads "moderate" on the map could be a healthy bean row dragging down a stressed maize strip, or the other way around. The color alone won't tell you which.
That's the core problem with reading any coarse-pixel index map over an intercropped field. The map is honest about what it measured: a blended reflectance signal. It was never built to separate crops within a mixed stand. Row spacing on most intercropped smallholder plots runs well under the pixel's footprint, so the index is smearing the plot's internal variation into a single number.
Reading the map you have
Before pulling any conclusion from an index reading, check the plot size and row layout against the pixel's ground sampling distance. A plot that spans only one or two pixels is giving you a weighted average across every crop in the intercrop mix, read as one flat value with no way to pull a single species back out. A few habits help:
- Treat a single pixel value as a summary of the whole plot rather than a reading on any one crop in it. Compare it week to week on the same plot instead of against a monocrop benchmark.
- Watch for drops that line up with the harvest of one intercropped species. Pulling the beans can pull the index down even when the maize underneath is doing fine.
- Check boundary pixels against the actual plot edge. Footpaths, hedgerows, and shared boundary strips often contaminate the reading more than the intercrop itself does.
- Ground-truth at canopy closure. Early in the season, bare soil between young rows dominates the signal more than either crop does.
None of these habits change what the sensor measured. They keep you from reading more precision into the map than the sensor delivered on a mixed stand this fine.
Where a finer look changes the read
Fusing a sharper look onto the same wide-swath pass pulls the index value down to the size of the field boundary a farmer actually drew, instead of a grid cell that happens to overlap several plots at once. That's the approach behind the weekly index being built at Field Scale Index: wide-swath multispectral passes fused with finer resolution looks, aimed at fields that get smeared into a handful of mixed pixels under standard resolution. It's early access, built out field type by field type rather than shipped as one finished layer for every intercrop pattern, so check current coverage before planning a season around it.
Until a field-scale reading exists for your plot type, pair whatever index map you have with what you already know about the intercrop: row direction, the ratio of crop types, and planting dates for each. An index map on an intercropped plot answers "has something changed here" far better than it answers "which crop changed." Keep the question narrow and the map stays useful, even at coarse resolution.
If you advise plots like these and want to see how field-scale coverage is coming along, our early-access page has the current detail on cadence and which field types are live so far.