How many fields can one agronomist track with a weekly index feed?
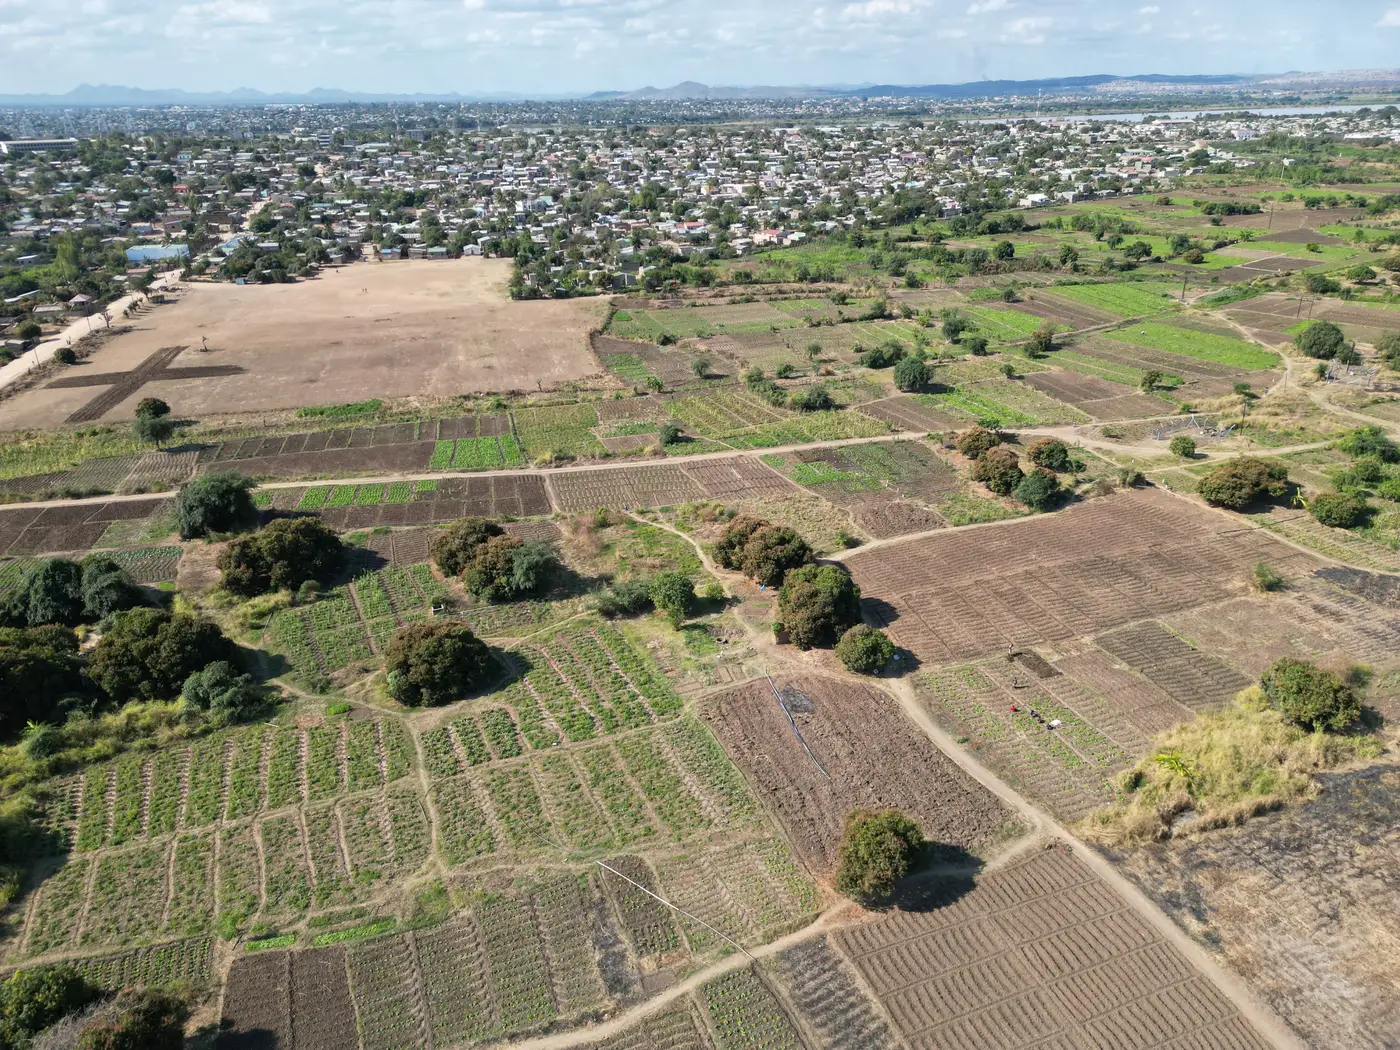
Ask ten extension officers how many fields they can reasonably carry on a caseload and you'll get ten different numbers, usually somewhere between 150 and 400 smallholder plots per advisor, depending on terrain, transport, and how scattered the parcels are. That number has always been set by how fast a person can physically get to a field, walk the rows, and write up a note. A weekly vegetation index feed changes the math, but not in the way most pitches imply.
Caseload used to be a transport problem
Before remote monitoring, caseload planning was really transport planning. An officer covering a union council with motorbike access could clear more ground than one relying on shared transport or footpaths during the rains. Index data wasn't the constraint, because there wasn't any at field scale yet. The constraint was literally getting a body to the plot.
A weekly feed removes the need to check every field in person just to confirm it's fine. That's the real caseload shift: fewer blind visits, more visits that are actually necessary. But that only works if the reading you're looking at corresponds to the field you think it does.
Why pixel size decides your real caseload
This is where a lot of advisory services get burned. A wide-swath multispectral pass with a 10-30 m source pixel sounds precise until you remember a 0.3-hectare smallholder plot is smaller than a single pixel. That pixel averages your farmer's maize together with the neighbor's cassava, a hedgerow, and whatever's growing in the strip between them. You can pull a weekly index value for that coordinate, but the number describes everything inside that pixel, lumped together.
So the honest answer to how many fields one agronomist can track with a weekly index feed depends on whether the feed resolves individual fields or hands you a regional average and calls it a reading. A coarse feed can technically cover thousands of plots a week and tell you almost nothing useful about any one smaller than its own pixel. An officer who trusts that data at face value is trading visit time for false confidence, and the real fieldwork comes right back when the numbers don't match what farmers are reporting.
What grows a caseload
The lever that matters is triage, not coverage. If the weekly reading holds up at the scale of an individual smallholder plot, an advisor can spend less time confirming a field is fine and more time on the fields the data flags as off-trend. That's how a caseload genuinely grows: fieldwork gets redirected toward the plots that need eyes on them, instead of spread evenly across everyone regardless of need.
Caseload planning should start from a count: how many of your fields are smaller than the sensor's native pixel. That share is the part of your caseload a coarse feed can't speak to with any precision. For many smallholder advisory areas, that's most of the roster.
Field Scale Index is built around this gap: it fuses wide-swath multispectral passes with sharper looks to produce a weekly reading resampled to field scale, instead of handing you a regional average and leaving you to guess which farmer it belongs to. It's early access, built out field type by field type rather than as a finished national layer, so it's worth checking which field types are covered before building a season's caseload plan around it. You can see where the current build stands and join the waitlist if your advisory area fits.
Caseload planning with any weekly index feed, field-scale or not, still needs a verification rhythm rather than blind trust in the number. But the fields worth spot-checking should be the ones the data flags, not every plot on the roster because the pixel was too coarse to say anything field-specific in the first place. That's the difference between a feed that expands what one officer can carry and one that just adds a chart to the same visit schedule you had before.
If per-field clarity is the piece missing from your caseload plan, it's worth a look at how the fusion approach works.