Field notes: the week two neighboring plots told completely different stories
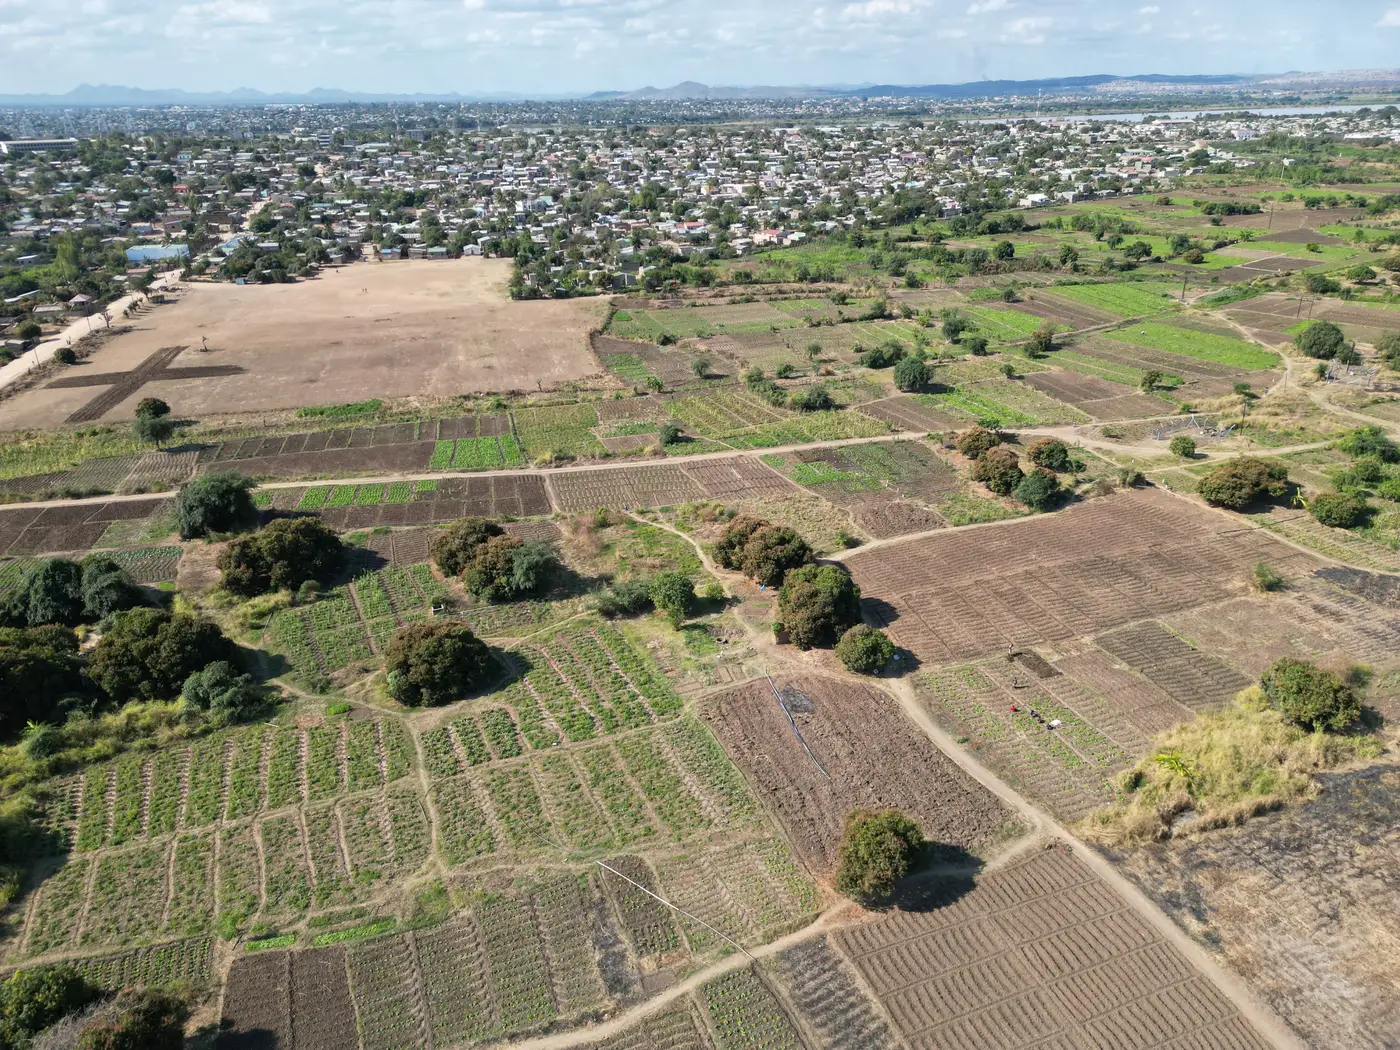
A field officer we talked to last month described a visit that's become a familiar kind of headache. Two plots, maybe a third of a hectare each, sitting side by side along the same irrigation furrow. Same soil, same planting date, same seed lot bought from the same agro-dealer stall. On the regional vegetation index pulled that week, both pixels read nearly identical. Healthy green, nothing flagged.
On the ground, one plot was fine. The other had a patch of stunted maize along its eastern edge, water stress from a blocked furrow that hadn't reached that far. The farmer had already noticed and was asking for advice. The index hadn't noticed anything, because the index wasn't really looking at either plot on its own.
This is the part that's easy to forget when you're staring at a tidy index map on a tablet. A wide-swath multispectral pass at 10 to 30 meters doesn't resolve a third-hectare plot. It resolves a block of land that might contain six or eight plots like these two, plus the footpath between them, plus a strip of fallow ground, plus whatever's growing on the far side of the furrow. The number you get back is an average of all of that. Two neighboring plots can carry genuinely different stories and still get folded into one reading, because from the sensor's point of view they're the same few mixed pixels.
This is close to the default condition for advisory work, the common case rather than the exception. Smallholder plots are small by definition, and a huge share of them fall well under the ground sample distance of the satellites doing weekly passes. The index exists, the cadence is there, but the resolution and the field size are mismatched in exactly the direction that matters most. You end up trusting a number that's technically correct for the block and wrong for the plot the farmer is standing in, with nothing in the reading itself to flag the gap.
What made the field officer's story stick with us is how ordinary the mismatch was. No drought, no pest outbreak, no dramatic divergence. Just a blocked furrow on one side of a shared boundary, the kind of small, local thing that advisory visits exist to catch. A coarse reading smooths exactly the detail a field visit is supposed to surface. If the two plots had been flagged separately, instead of blended into a shared regional figure, that stress signal would have shown up a week before the farmer had to ask.
It's a reminder that "field-level" and "field-scale" aren't the same claim. A lot of index products are field-level in the sense that they cover agricultural fields. Fewer are field-scale in the sense that each individual plot, down to a fraction of a hectare, gets its own number rather than a share of a neighborhood average. For smallholder advisory work specifically, where the whole point is catching the plot that's behaving differently from the one next to it, that distinction is the whole job.
We've been building toward exactly this problem: fusing the wide-swath multispectral pass with sharper looks so a plot gets resolved on its own terms instead of smeared into whatever block it happens to sit inside. The weekly cadence stays the same; the readings underneath it get sharper, field type by field type as the pipeline fills in. You can see where that stands and get on the list for a per-field reading as it opens up for more plot types.
If this week's visits turn up another pair of neighbors telling different stories under one shared pixel, we'd like to hear about it.